Introducing Atlas 1.0
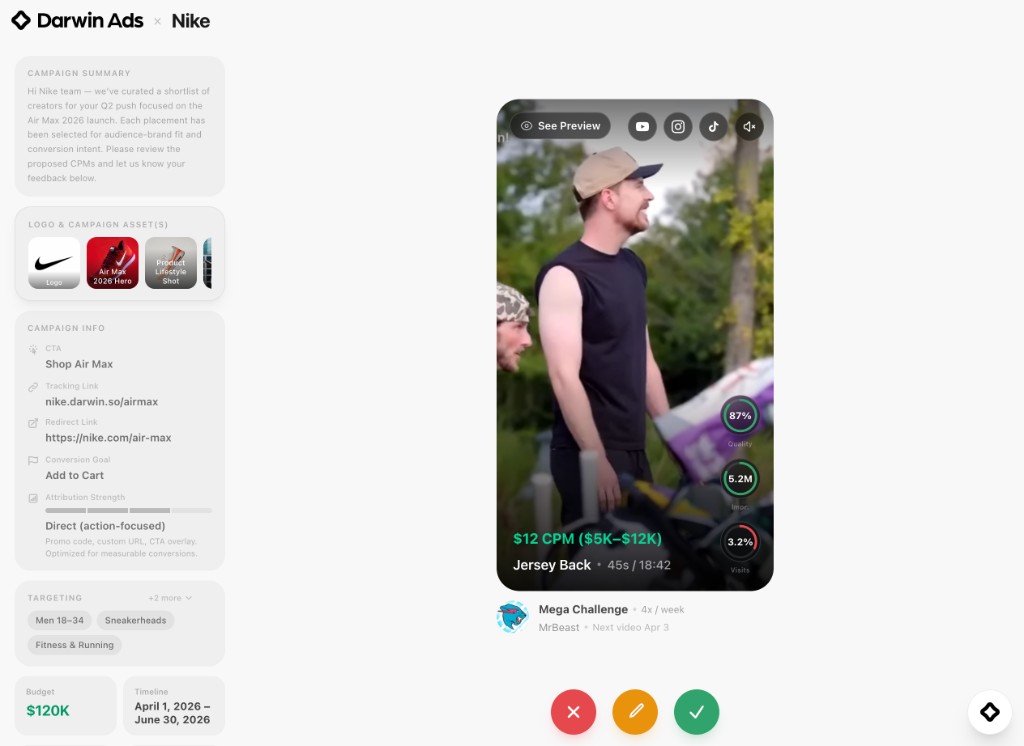
Today we're releasing Atlas 1.0 — our first production model family, and the core intelligence behind Darwin's embedded advertising pipeline. Atlas is responsible for every step between a raw creator video and a live, brand-matched placement: detecting where ads can go, generating composited content that looks native to the footage, recommending the right campaigns for each creator, and forecasting placement performance before a dollar is committed. This post is a detailed account of how each component works, what we benchmarked it against, and where we're going next.
Adaptive Ad Generation
Adaptive Ad Generation is Atlas's most compute-intensive component. Given a video, a set of identified ad slots, and a brand asset, the generation pipeline must composite the brand material into the video in a way that is contextually accurate and visually indistinguishable from the original footage. Creator content spans outdoor scenes, studio setups, vlogs, unboxings, and b-roll — each with different lighting conditions, camera motions, and surface geometries. A placement that looks natural in one scene looks obviously artificial in another, and no fixed set of rules can account for that variance.
The generation pipeline operates as an agentic loop across five stages: scene analysis, method selection, execution, quality verification, and refinement. Scene analysis characterizes the shot — objects present, camera motion type, depth complexity, lighting directionality, and whether any text regions need to be preserved. Method selection chooses the compositing approach: direct overlay for static surfaces, inpainting for object replacement, motion-tracked compositing for moving camera shots, or generative modification for complex motion scenes. Execution runs the selected method. Verification scores the output across five quality dimensions. Refinement decides whether to accept, retry, or escalate to a fallback.
Decoupling perception from reasoning
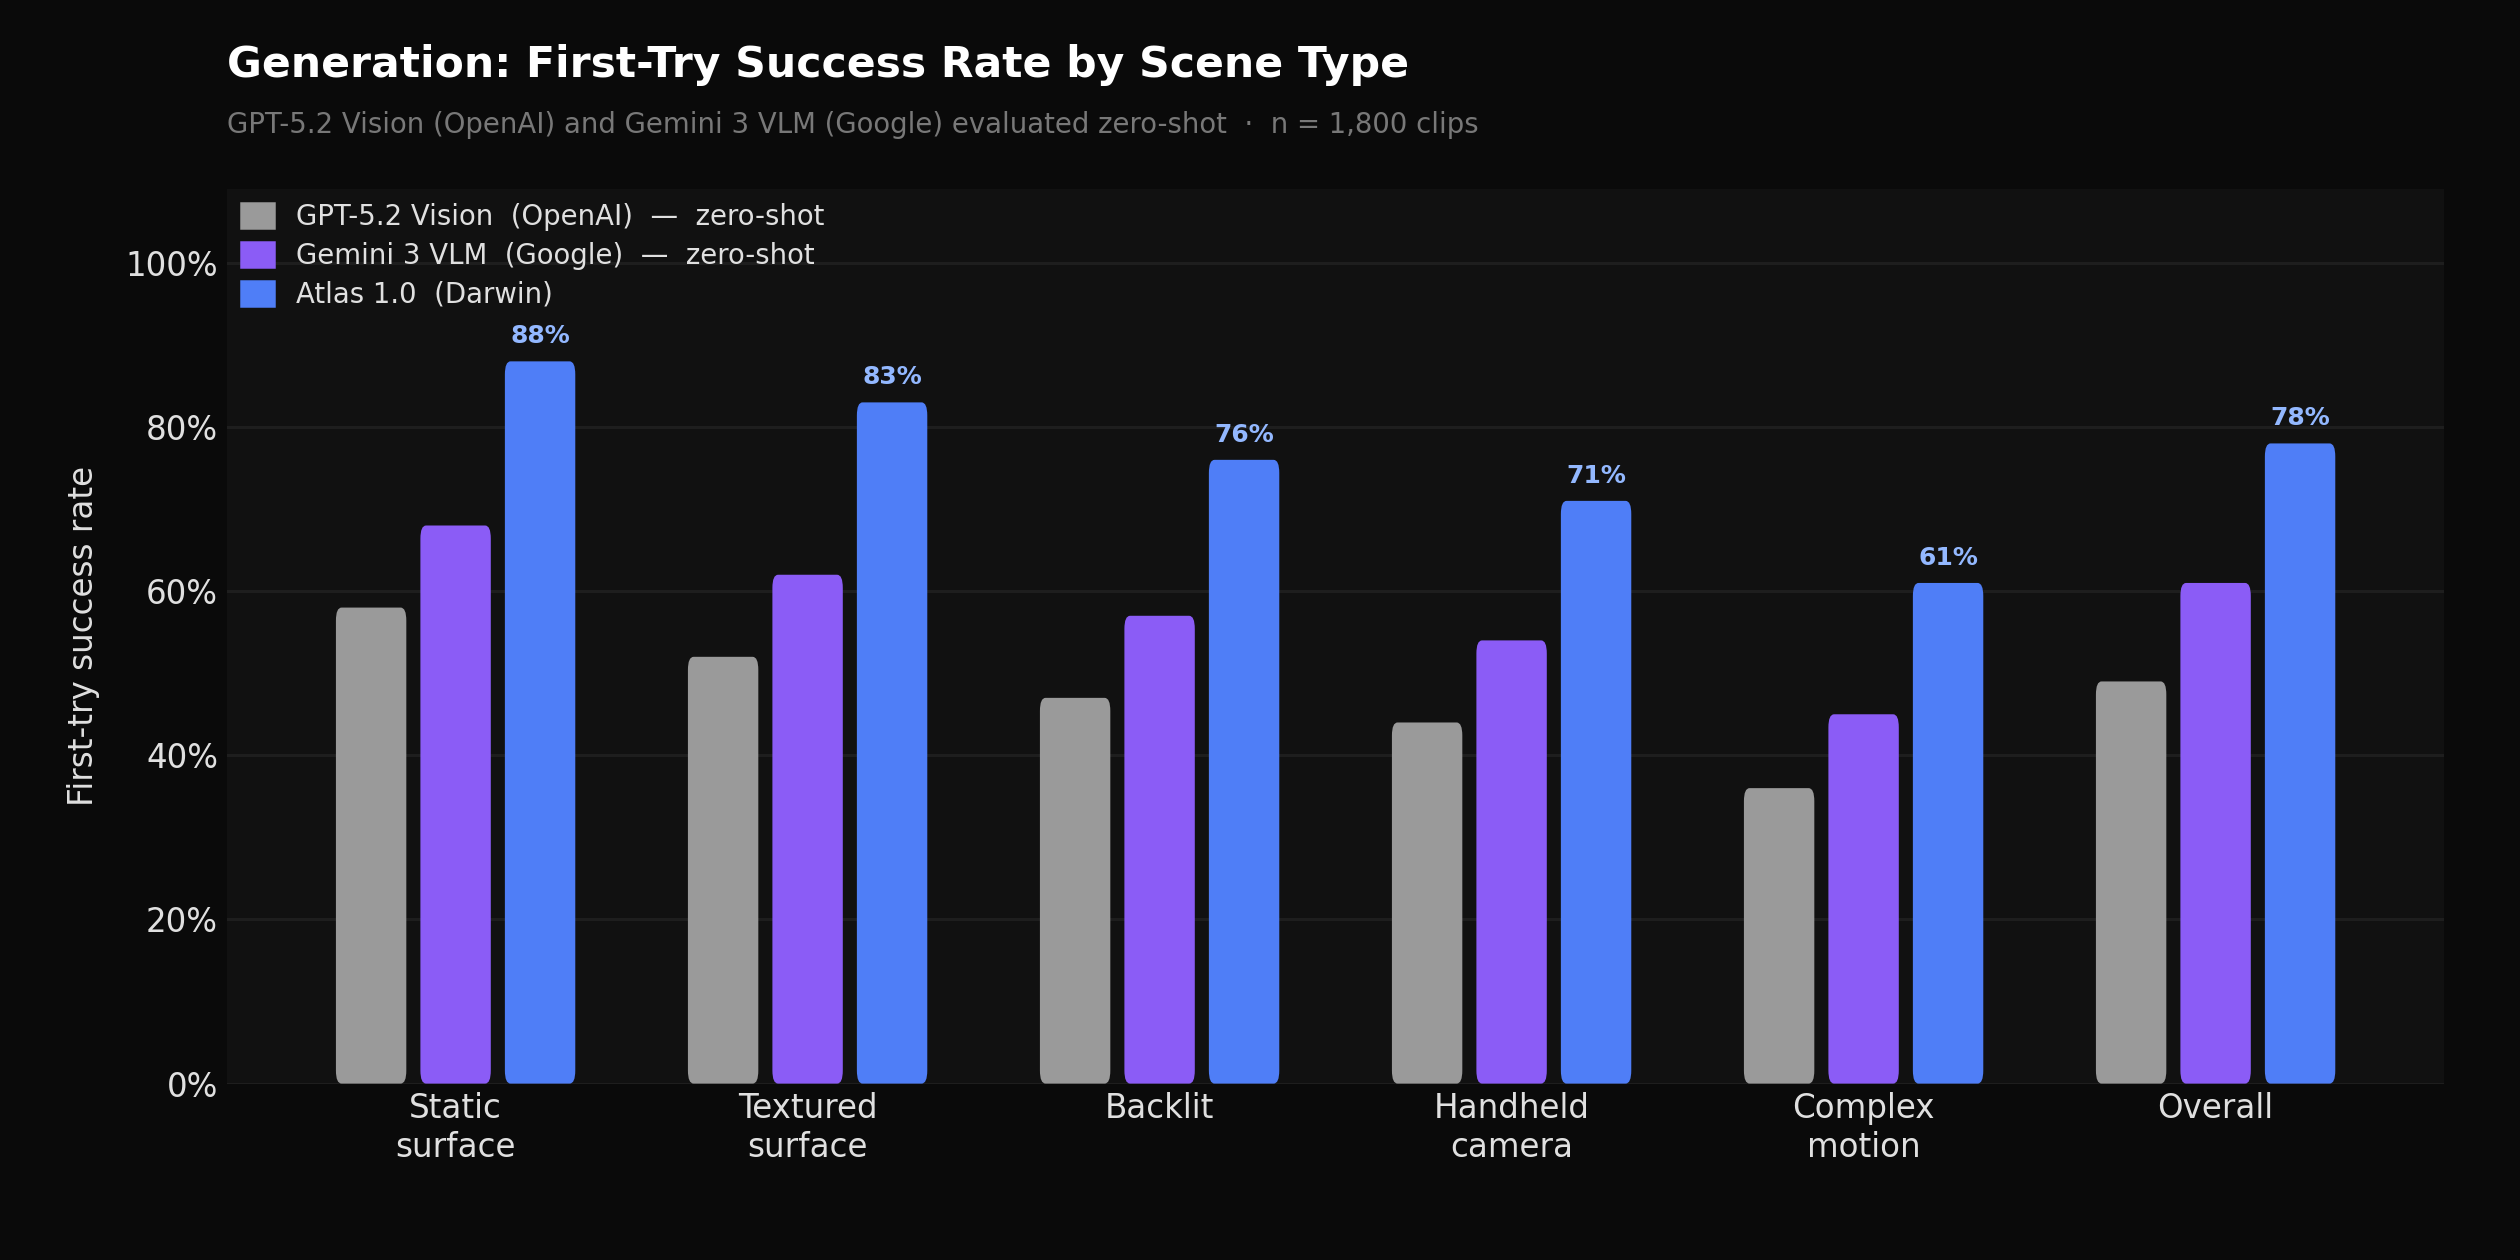
Atlas 1.0 first-try generation success rate by scene type vs. GPT-5.2 Vision (OpenAI) and Gemini 3 VLM (Google), both evaluated zero-shot, across 1,800 benchmark clips
The core architectural decision in Atlas 1.0's generation pipeline is a clean separation between perception and reasoning. A single model asked to simultaneously characterize a scene and decide what to do about it consistently underperforms on the reasoning side — smaller vision-language models are strong perceptually, accurately describing object positions, surface orientations, lighting angles, and motion patterns, but they struggle with multi-step method selection in ambiguous scenes where the right choice between inpainting and motion-tracked compositing requires reasoning across scene characteristics and downstream quality implications.
Atlas 1.0 uses a purpose-trained VLM with a generation-specific LoRA adapter for all perception tasks — scene analysis, quality verification, and structured scene description generation. A separate frontier reasoning model handles method selection and refinement decisions, interpreting those descriptions and choosing compositing approaches based on accumulated traces of what decisions led to high-quality outcomes. The VLM is trained end-to-end; the reasoning model improves through structured prompt refinement as we accumulate production signal. On our internal benchmark of 1,800 diverse clips spanning travel, tech, lifestyle, gaming, and cooking content, Atlas 1.0 achieves a 78% first-try success rate — compared to 61% for Gemini 3 VLM (Google) and 49% for GPT-5.2 Vision (OpenAI), both evaluated zero-shot. Average compositing attempts per scene dropped to 1.4.
Quality scoring and fallback chains
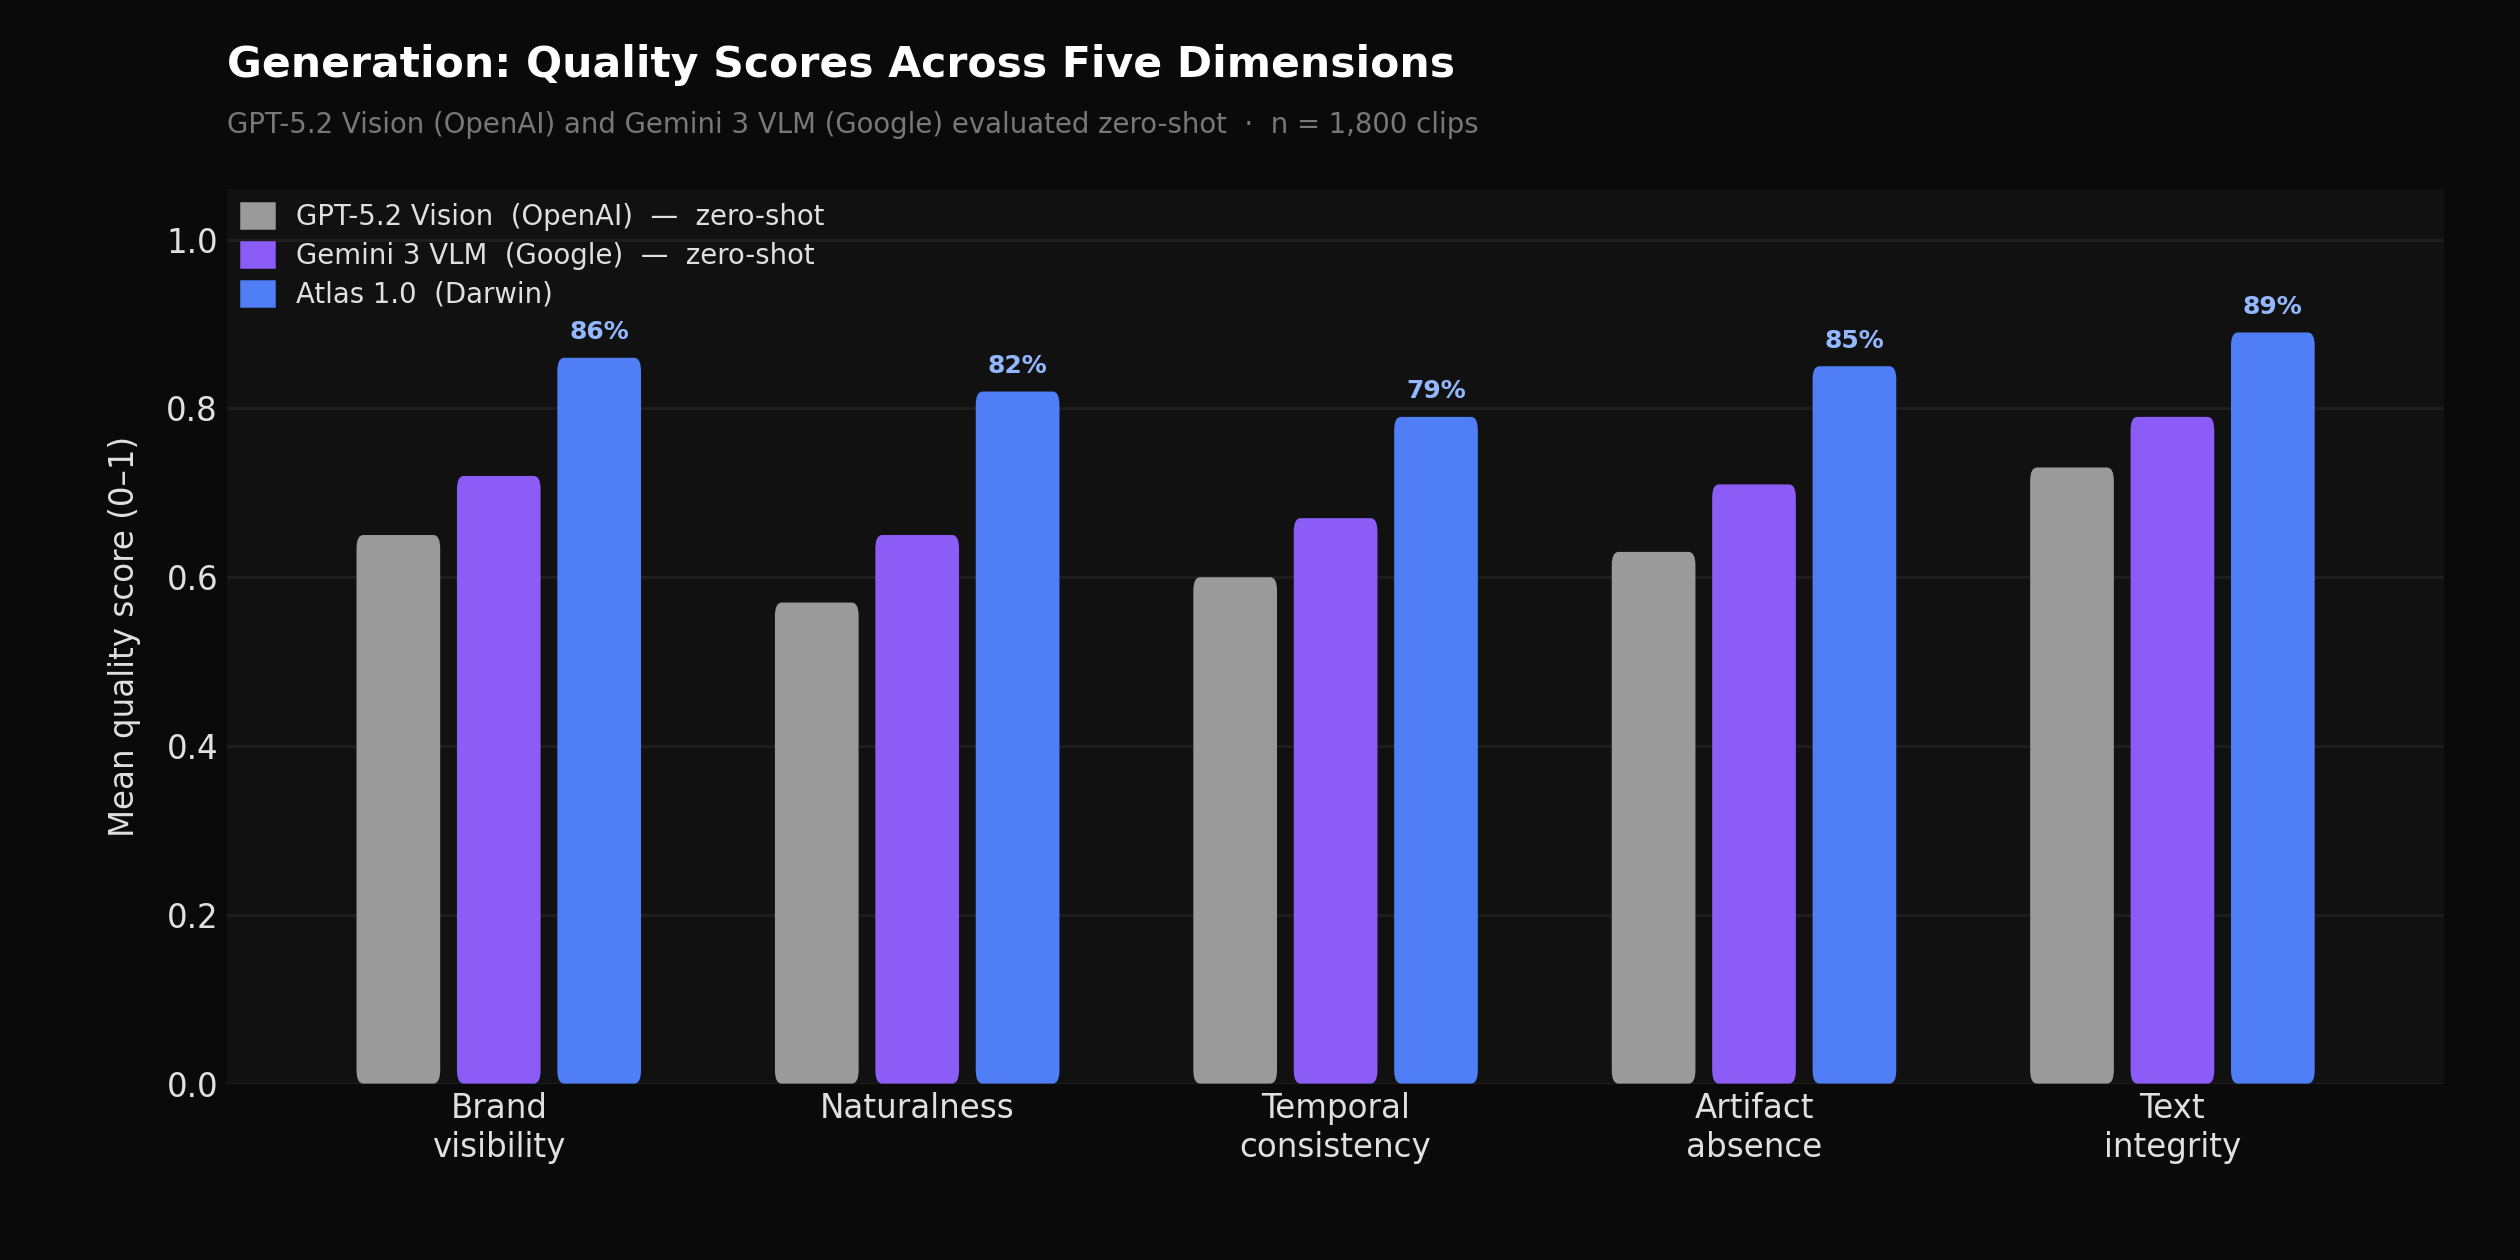
Quality score distributions across five dimensions (brand visibility, naturalness, temporal consistency, artifact rate, text integrity) for Atlas 1.0 vs. a rule-based compositing baseline on the benchmark set
Every generated clip is scored across five dimensions before being accepted: brand visibility, naturalness, temporal consistency, absence of visual artifacts, and text integrity. These are evaluated by the verification VLM, which compares sampled frames from the original and processed video. Atlas 1.0's verification model was trained on a large set of difficult negatives — cases where compositing was technically plausible but contextually wrong — including placements where a brand asset was correctly positioned but lit inconsistently with surrounding objects, or where a product logo was readable but sitting in a shadow zone that would have been invisible to viewers.
Fallback selection in Atlas 1.0 is failure-mode aware rather than rule-ordered. A temporal consistency failure triggers motion-tracked compositing before generative approaches; a severe artifact failure skips retries entirely and flags for human review. In comparison, a rule-based fallback system that steps through a fixed ordered list produces 34% more unnecessary retries to reach the same acceptance rate. The flag-for-human-review rate on Atlas 1.0 sits below 6% on our benchmark set.
Ad Slot Identification
Ad Slot Identification is the model responsible for detecting placement-eligible moments across creator video content. It runs against raw video, extracts frames and audio, transcribes speech, and produces a structured set of ad slots — each with a timestamp range, a slot type, a spatial region, a scene description, and a quality score. The output feeds every downstream component: generation uses it to know where and how to composite; campaign recommendations use it to match brand inventory to content; simulation uses it to estimate performance.
Slot identification is harder than it appears from the outside. A passive placement opportunity — a product sitting on a desk in the background — is obvious to a human but requires the model to simultaneously understand scene geometry, viewer attention patterns, and brand suitability. An ad-read slot — a natural pause where a creator-style sponsor segment can be spliced in — requires the model to parse speech, identify narrative breaks, understand duration constraints, and evaluate the creator's tone to ensure the segment will feel native. Atlas 1.0 identifies four slot types: passive placements, integrated placements where the product is woven naturally into the content, active endorsements where the creator demonstrates the product directly, and ad reads.
Placement Quality Index
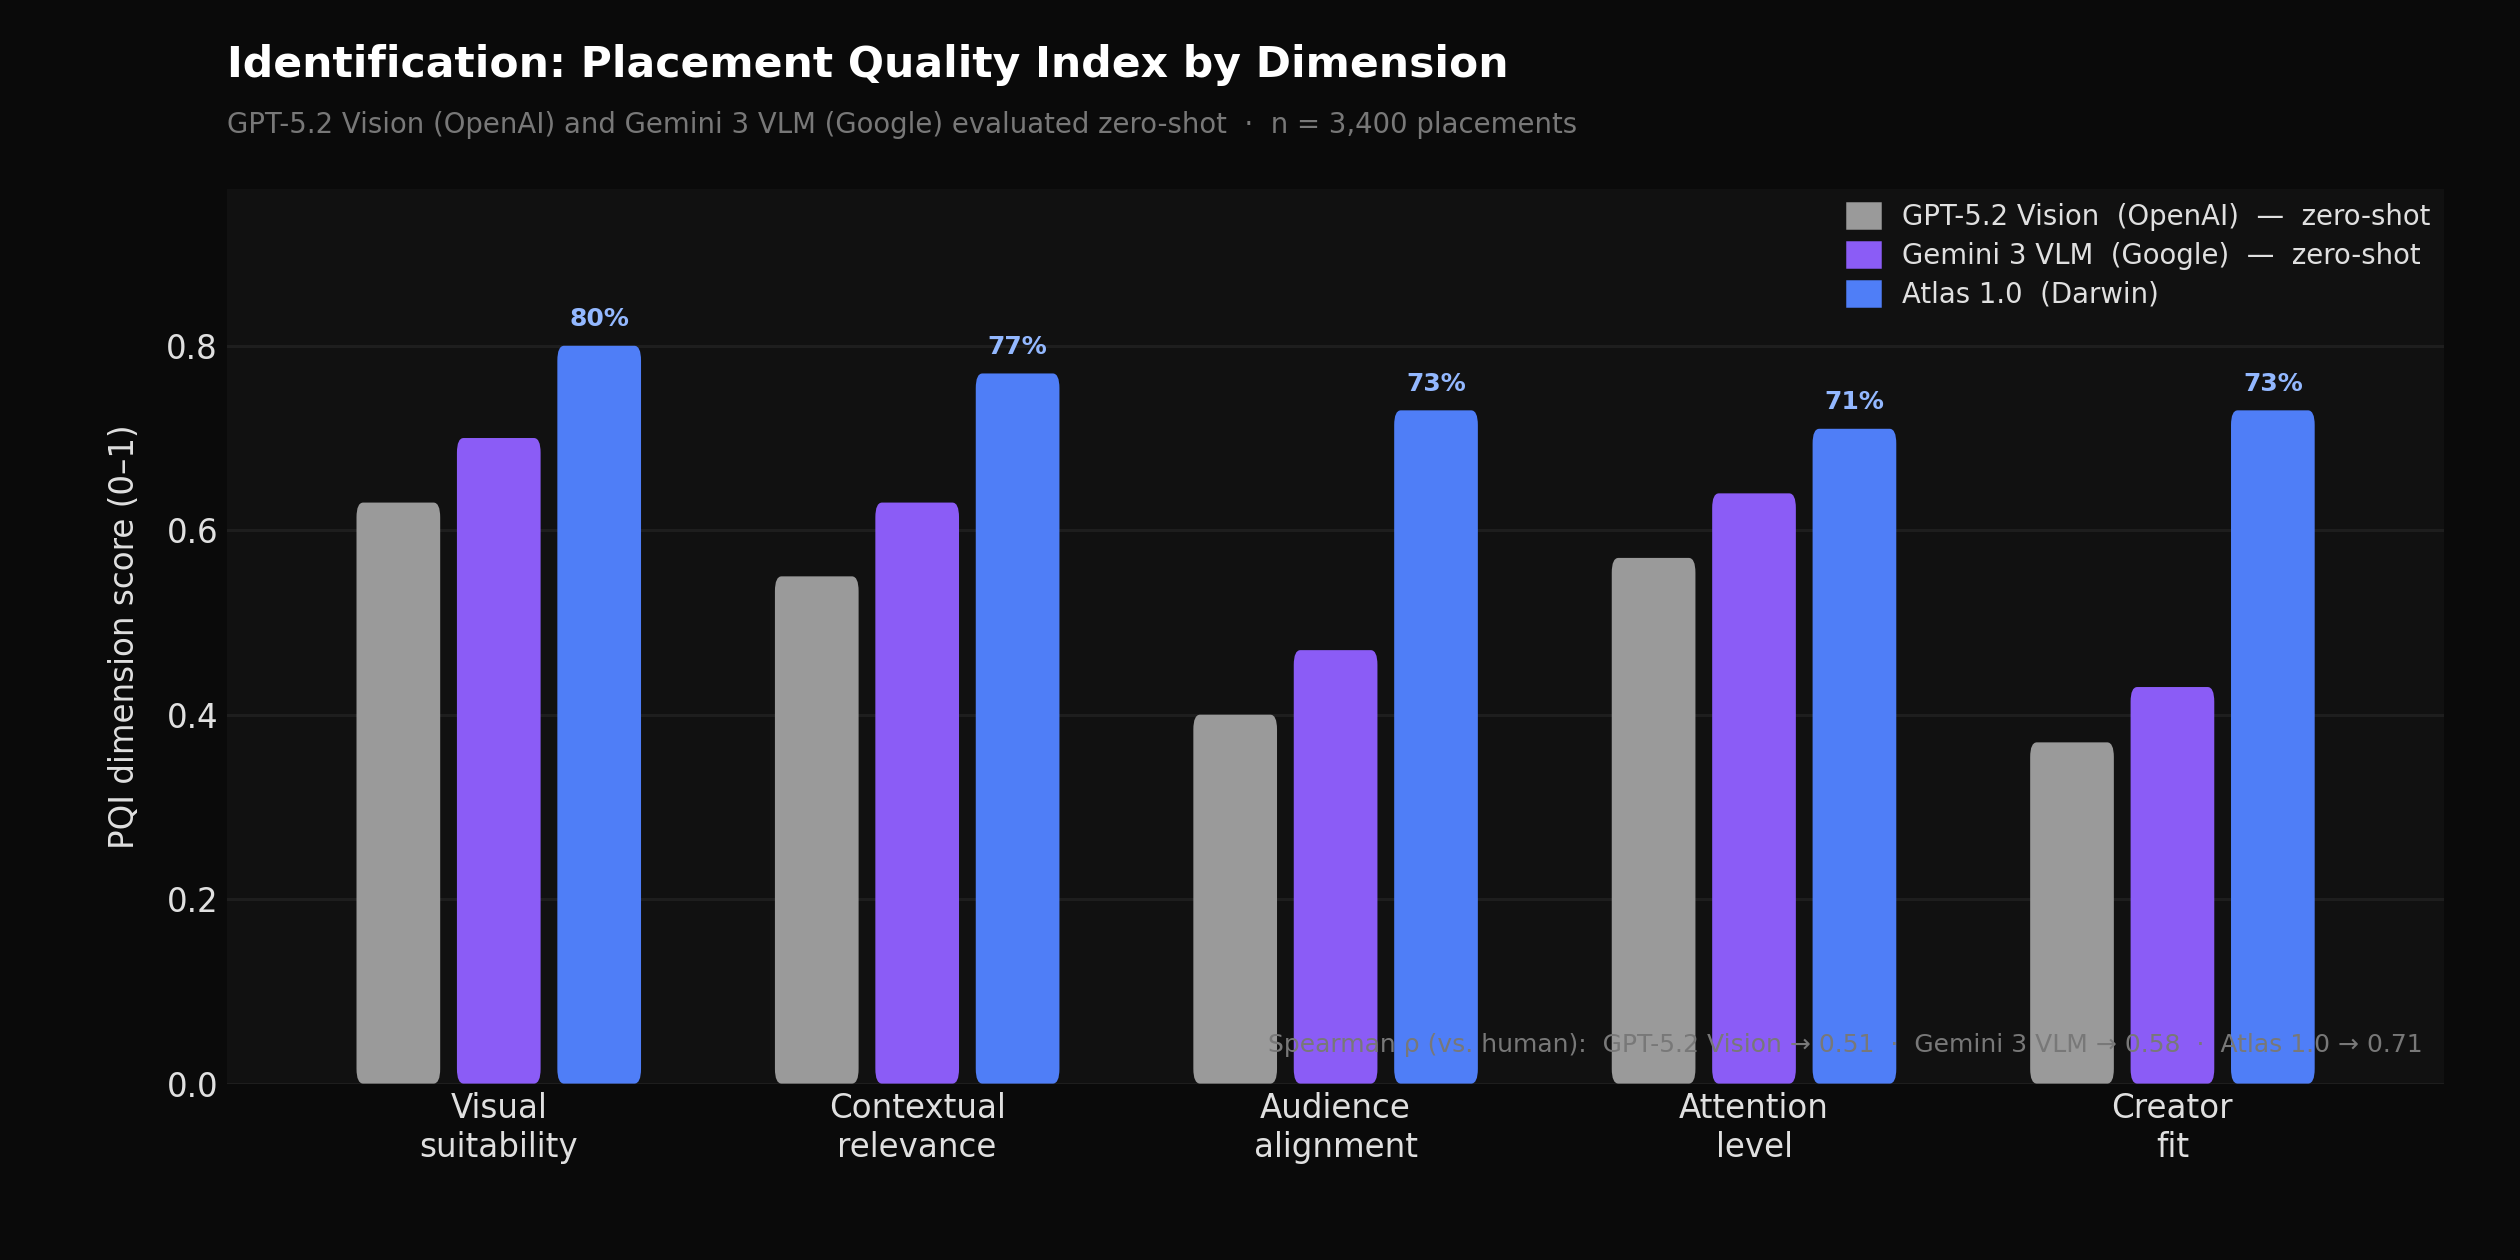
PQI dimension scores for Atlas 1.0 vs. a heuristic-based scoring baseline, measured against 3,400 manually reviewed placements rated by brand safety reviewers
The Placement Quality Index (PQI) is a five-dimension score that evaluates each detected slot: visual suitability, contextual relevance, audience alignment, attention level, and creator fit. Prior heuristic approaches compute each dimension independently from frame-level features — evaluating visual suitability from scene geometry rules, contextual relevance from keyword matching, and audience alignment from demographic category lookups. These approaches are fast and interpretable but drift significantly on creator-specific factors, where tone and audience fit can vary enormously within a single content category.
Atlas 1.0 reasons over visual features jointly with creator context — subscriber count, engagement rate, content category distribution, audience demographics, and historical CPM signals — to produce a unified PQI. Creator fit and audience alignment in particular benefit from this joint reasoning. Measured against a held-out set of 3,400 manually reviewed placements, PQI Spearman correlation with human ratings is 0.71 for Atlas 1.0, compared to 0.58 for Gemini 3 VLM and 0.51 for GPT-5.2 Vision, both evaluated zero-shot against the same held-out set. Average PQI on slots that route through to live campaigns is 0.74.
Latency and temporal recall
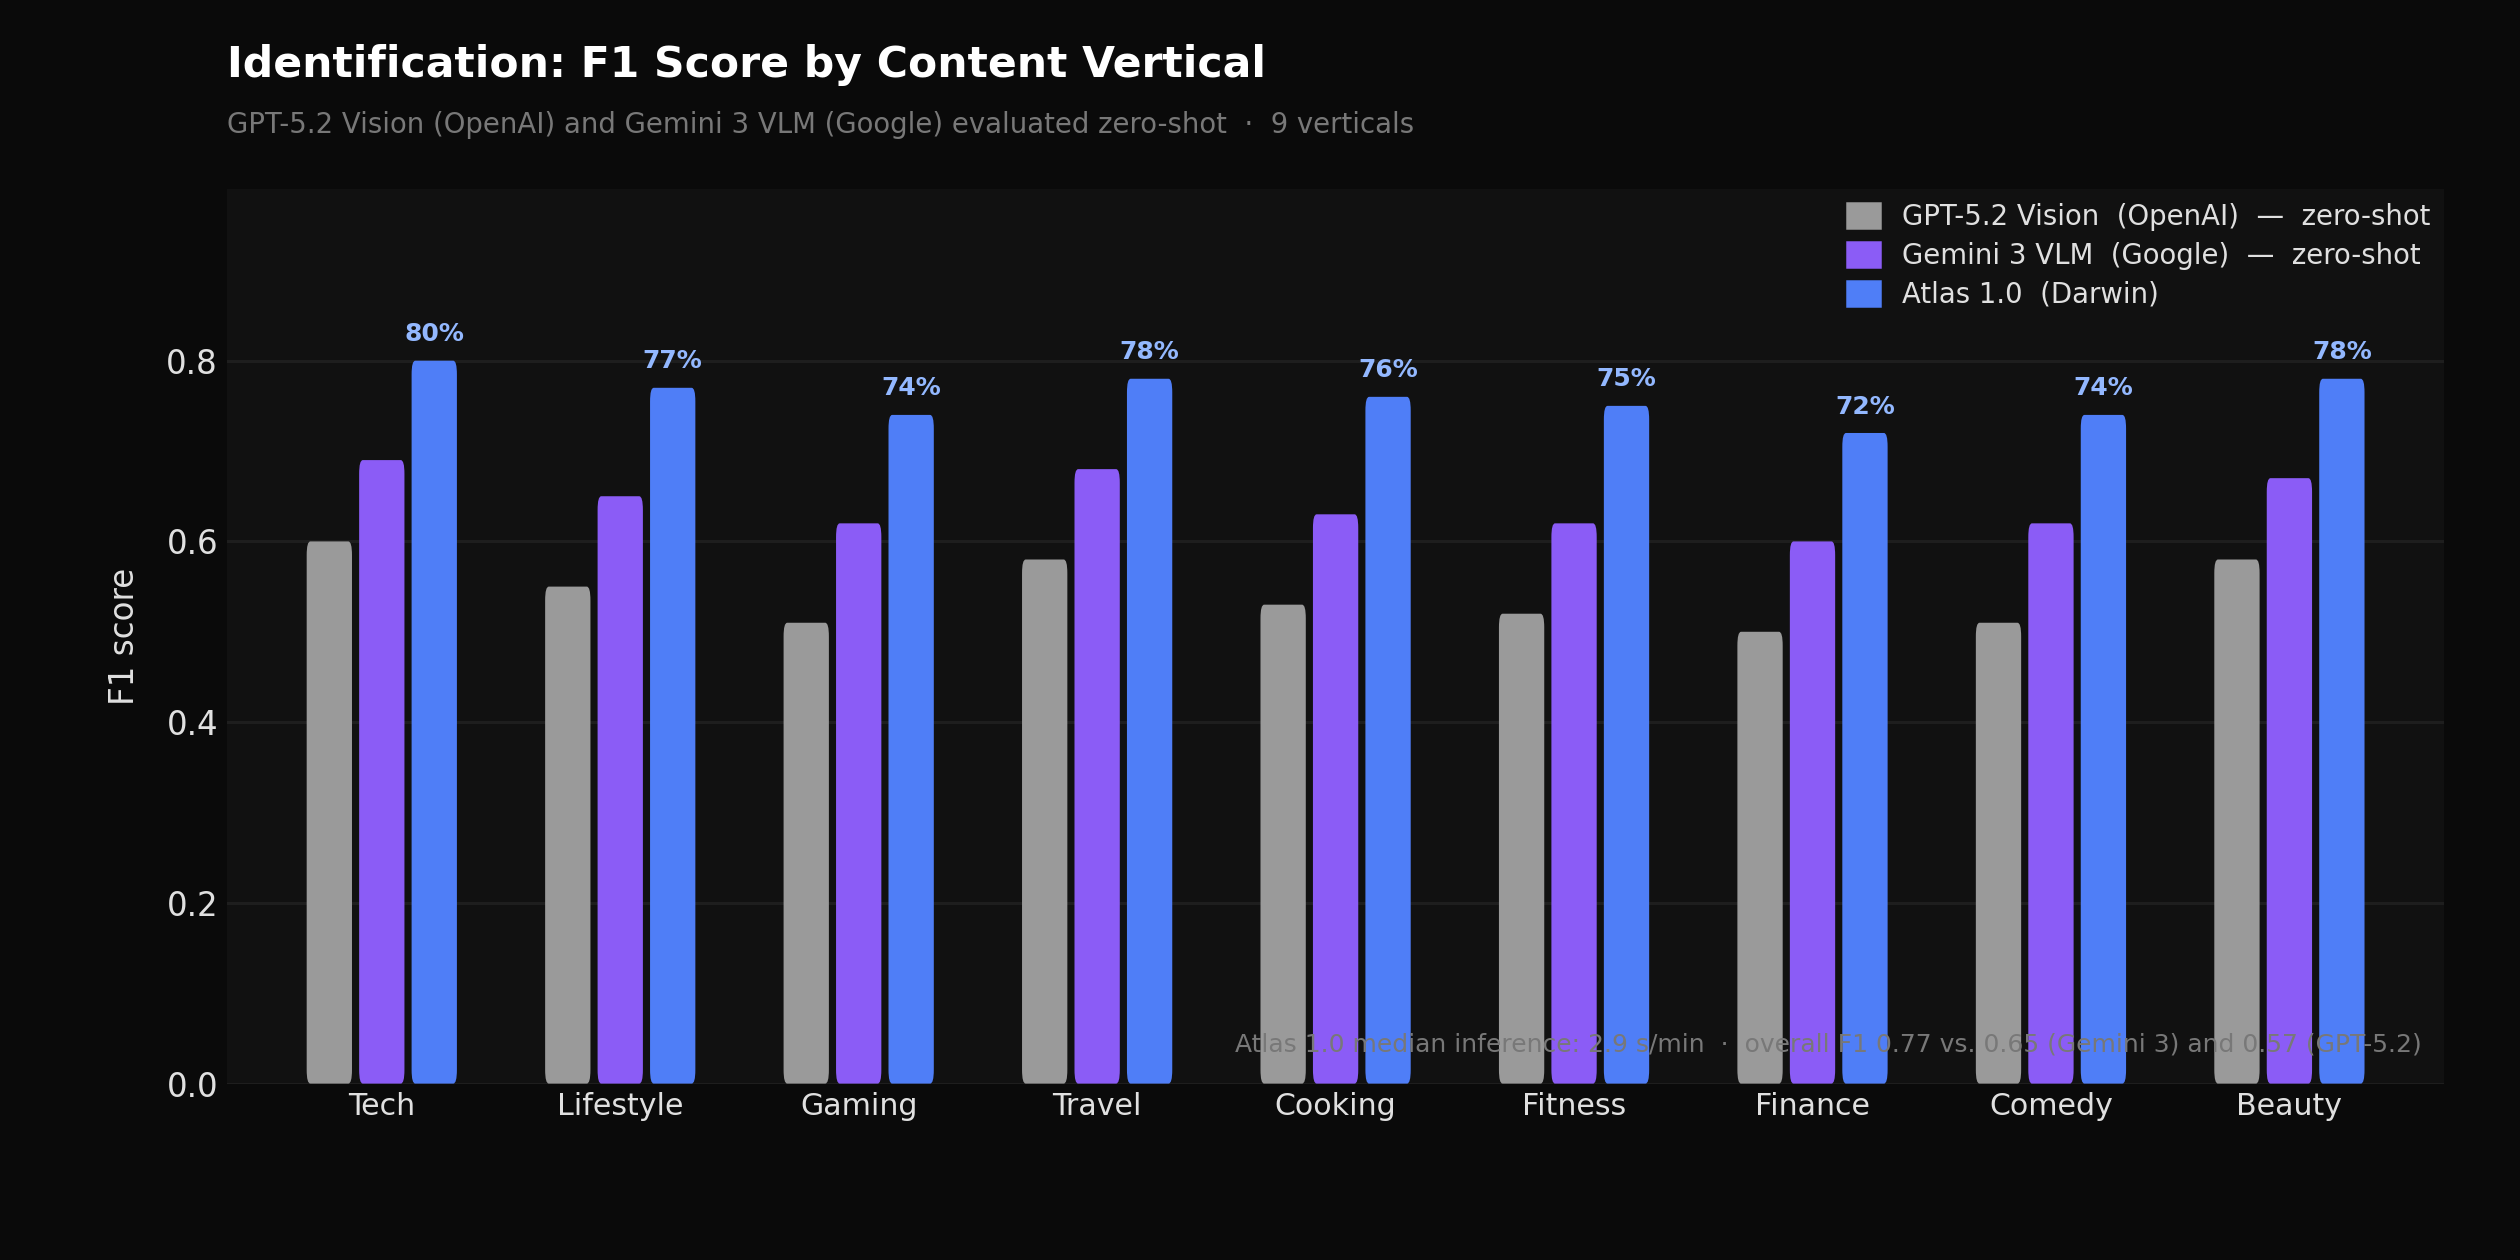
Per-category F1 score for Atlas 1.0 vs. GPT-5.2 Vision (OpenAI) and Gemini 3 VLM (Google), both zero-shot, across 9 content verticals
A sequential frame-by-frame approach to identification — processing each candidate window in series, running inference and scoring before moving to the next — averages 7.2 seconds per minute of video at production resolution. For long-form content this creates a meaningful delay between upload and available inventory. Atlas 1.0 parallelizes frame extraction and audio transcription, batches VLM inference across non-overlapping temporal windows, and applies an early-exit path for high-motion-variance segments where passive placements are structurally unlikely. Median latency is 2.9 seconds per minute — a 60% reduction from the sequential baseline — with p95 latency at 4.6 seconds per minute.
Atlas 1.0 also addresses a systematic false-negative pattern that affects vlog-style content with handheld camera movement. Integrated placement opportunities in fast-motion sequences were being missed when single-frame evaluation was used per candidate window: a moment that qualifies as a high-quality integrated placement may not look like one in any individual sampled frame, but does when confidence is aggregated across the full temporal window. Atlas 1.0 samples multiple frames per candidate window and aggregates confidence before making a slot-level accept/reject decision. Recall on fast-motion sequences improved by 27%. Overall identification F1 on our benchmark set is 0.77, versus 0.65 for Gemini 3 VLM and 0.57 for GPT-5.2 Vision, both evaluated zero-shot.
Ad Campaign Recommendations
Campaign Recommendations connects brand intent to creator inventory. A brand arrives with a campaign brief — a budget, a target audience, an objective (reach, engagement, or conversion), a timeline, and some sense of what kind of creator content fits their brand. The system finds the right slots across a large and heterogeneous creator catalog, ranks them by expected performance, and allocates budget across the selected set in a way that is efficient and diversified.
This is a retrieval and optimization problem with several unusual properties. Creator content is multimodal and semantically rich in ways that don't compress well into category labels. Audience overlap between superficially different niches is common and hard to predict from metadata alone. The mapping between brand intent and creator-content fit is highly specific to individual brand identities — two brands in the same product category can have completely different creator preferences based on tone, audience, and positioning. The system also needs to work for campaigns where the brand has no prior history on the platform.
Dense slot embeddings
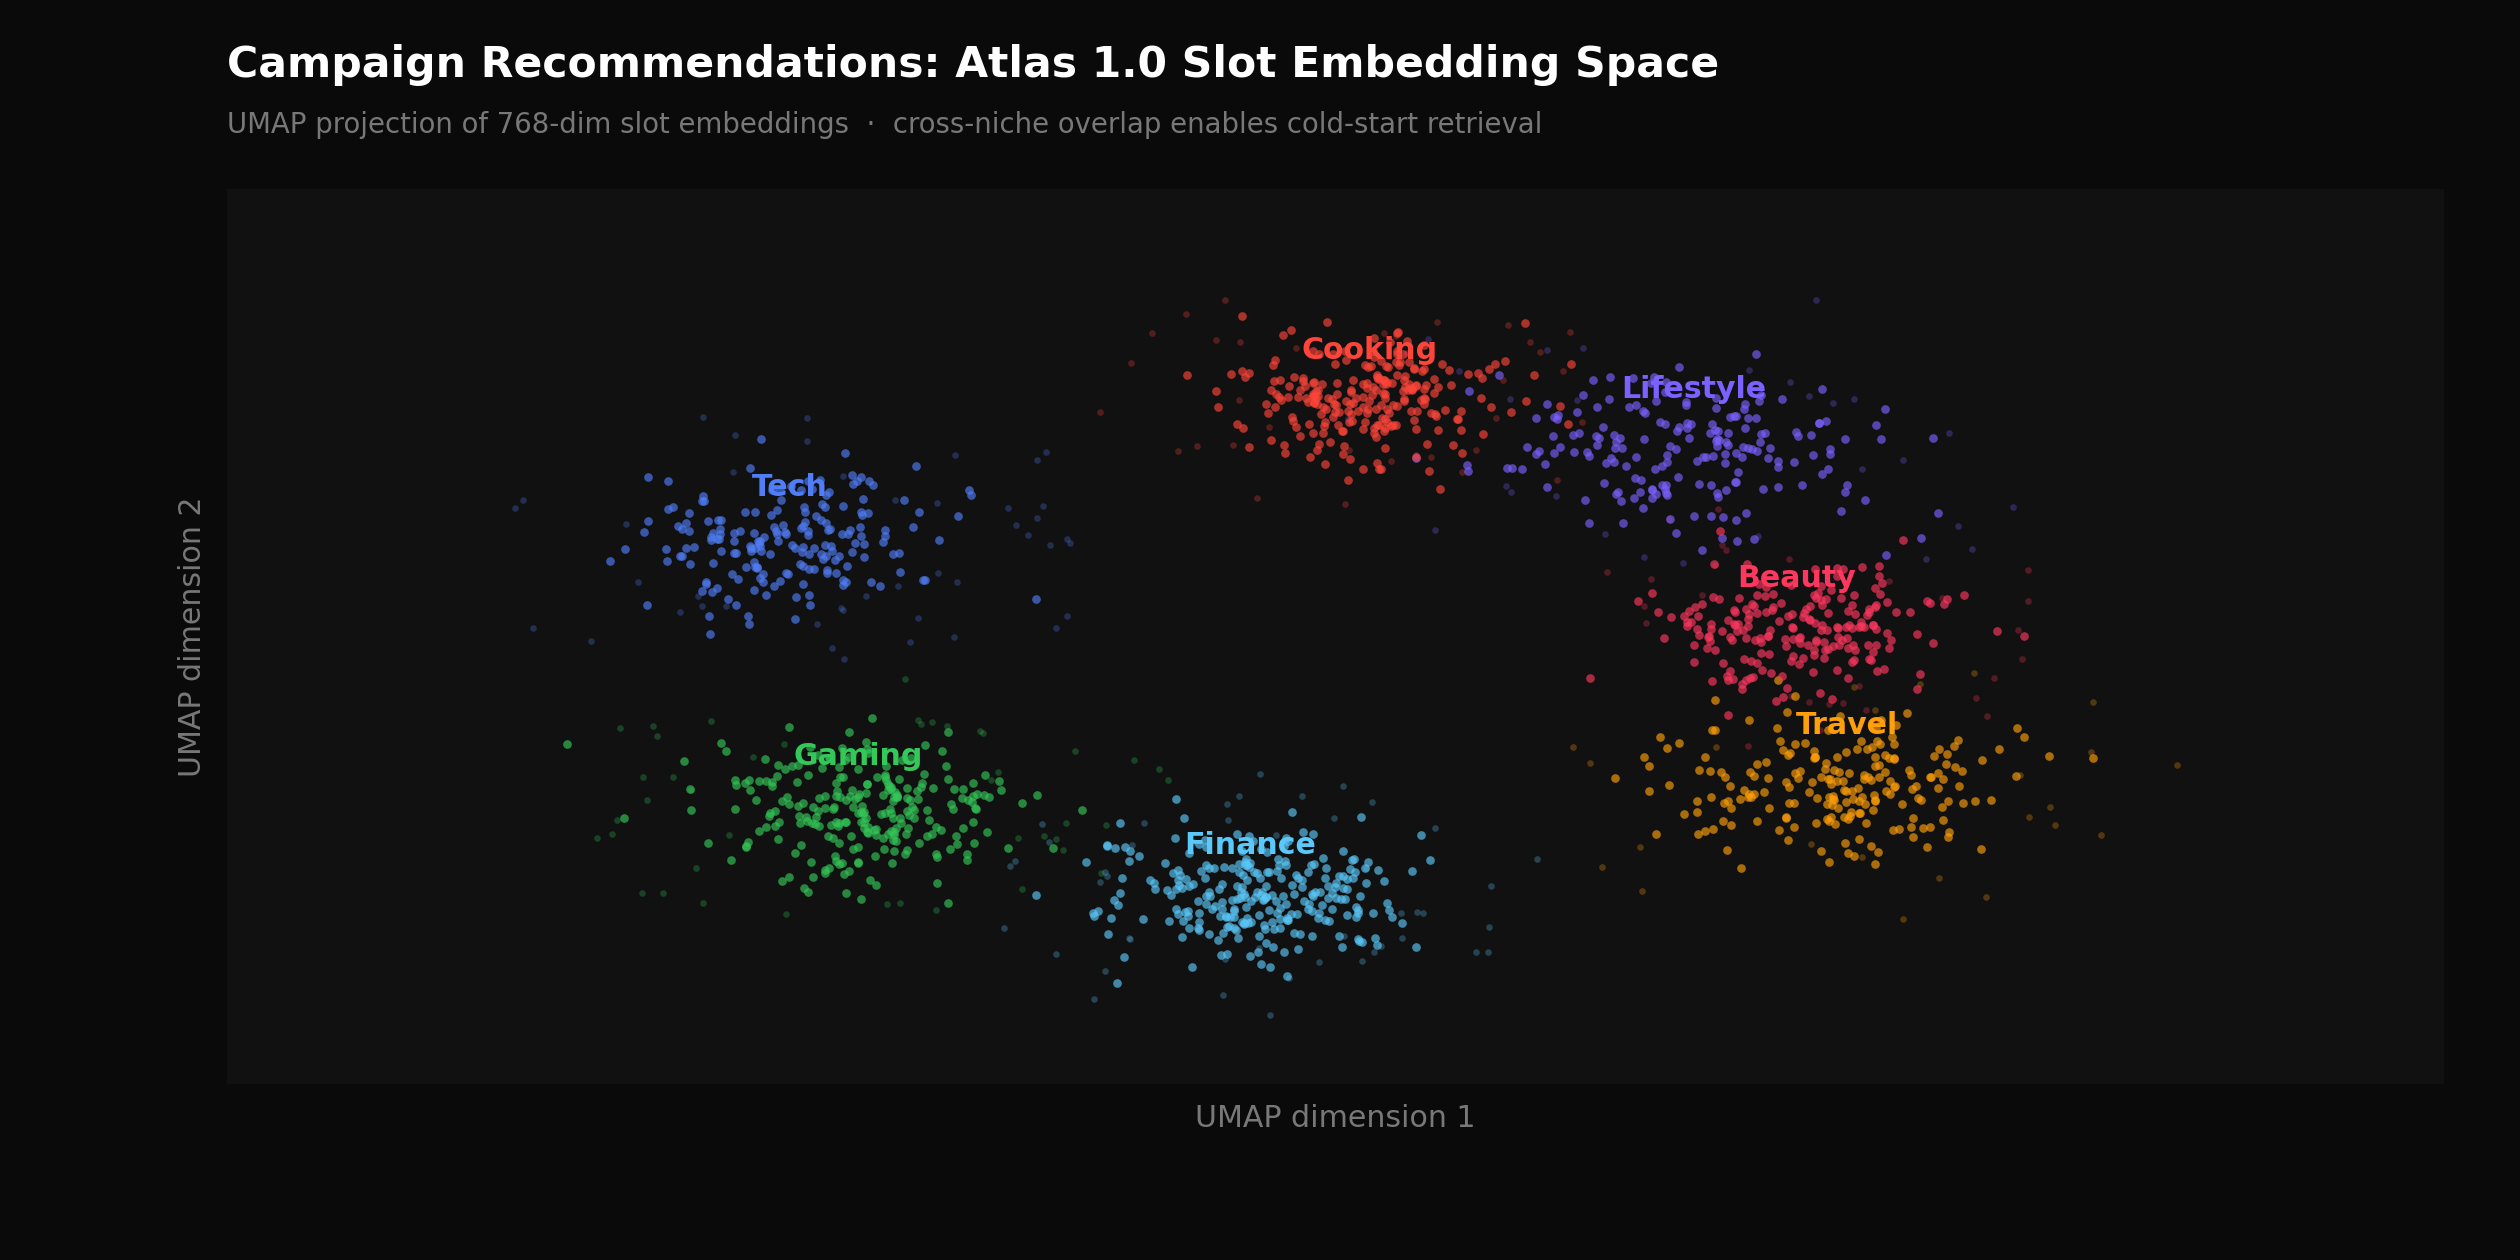
2D UMAP projection of 768-dimensional Atlas 1.0 slot embeddings colored by content category, showing cross-niche cluster structure that category-based retrieval cannot surface
Category-based retrieval — matching campaign targeting criteria against structured metadata labels such as content category, platform, and demographic ranges — is the standard approach in media buying tools. It works when brand criteria are explicit and inventory within a category is dense. It fails predictably in two scenarios: sparse inventory in a specific niche, and campaigns where the brand's target audience behaves similarly across content niches that don't share a label.
Atlas 1.0 replaces metadata matching with dense embedding-based retrieval. Each identified ad slot is encoded into a 768-dimensional vector capturing visual scene content, creator context, audience behavioral signals from engagement patterns across the creator's catalog, and semantic content from the video transcript. Campaign briefs are encoded in the same space using a separate encoder trained with contrastive objectives against historically approved campaign-slot pairs. Retrieval is a nearest-neighbor search over the slot index. This allows the system to surface non-obvious matches — a direct-to-consumer supplement brand finding strong inventory in productivity content because of overlapping audience purchase behavior, without any category label connecting the two.
On an evaluation set of 840 campaign-slot pairs rated by account managers and calibrated against actual campaign performance, NDCG@10 for Atlas 1.0 is 0.67, compared to 0.56 for Gemini 3 VLM and 0.51 for GPT-5.2 Vision, both evaluated zero-shot on the same set. Recall@20 — the fraction of account-manager-approved slots appearing in the top 20 results — is 0.63 for Atlas 1.0, versus 0.48 for Gemini 3 VLM. For campaigns with prior placement history on the platform, we also support retrieval conditioned on reference placements, which further improves match quality for repeat advertisers.
Constrained budget allocation
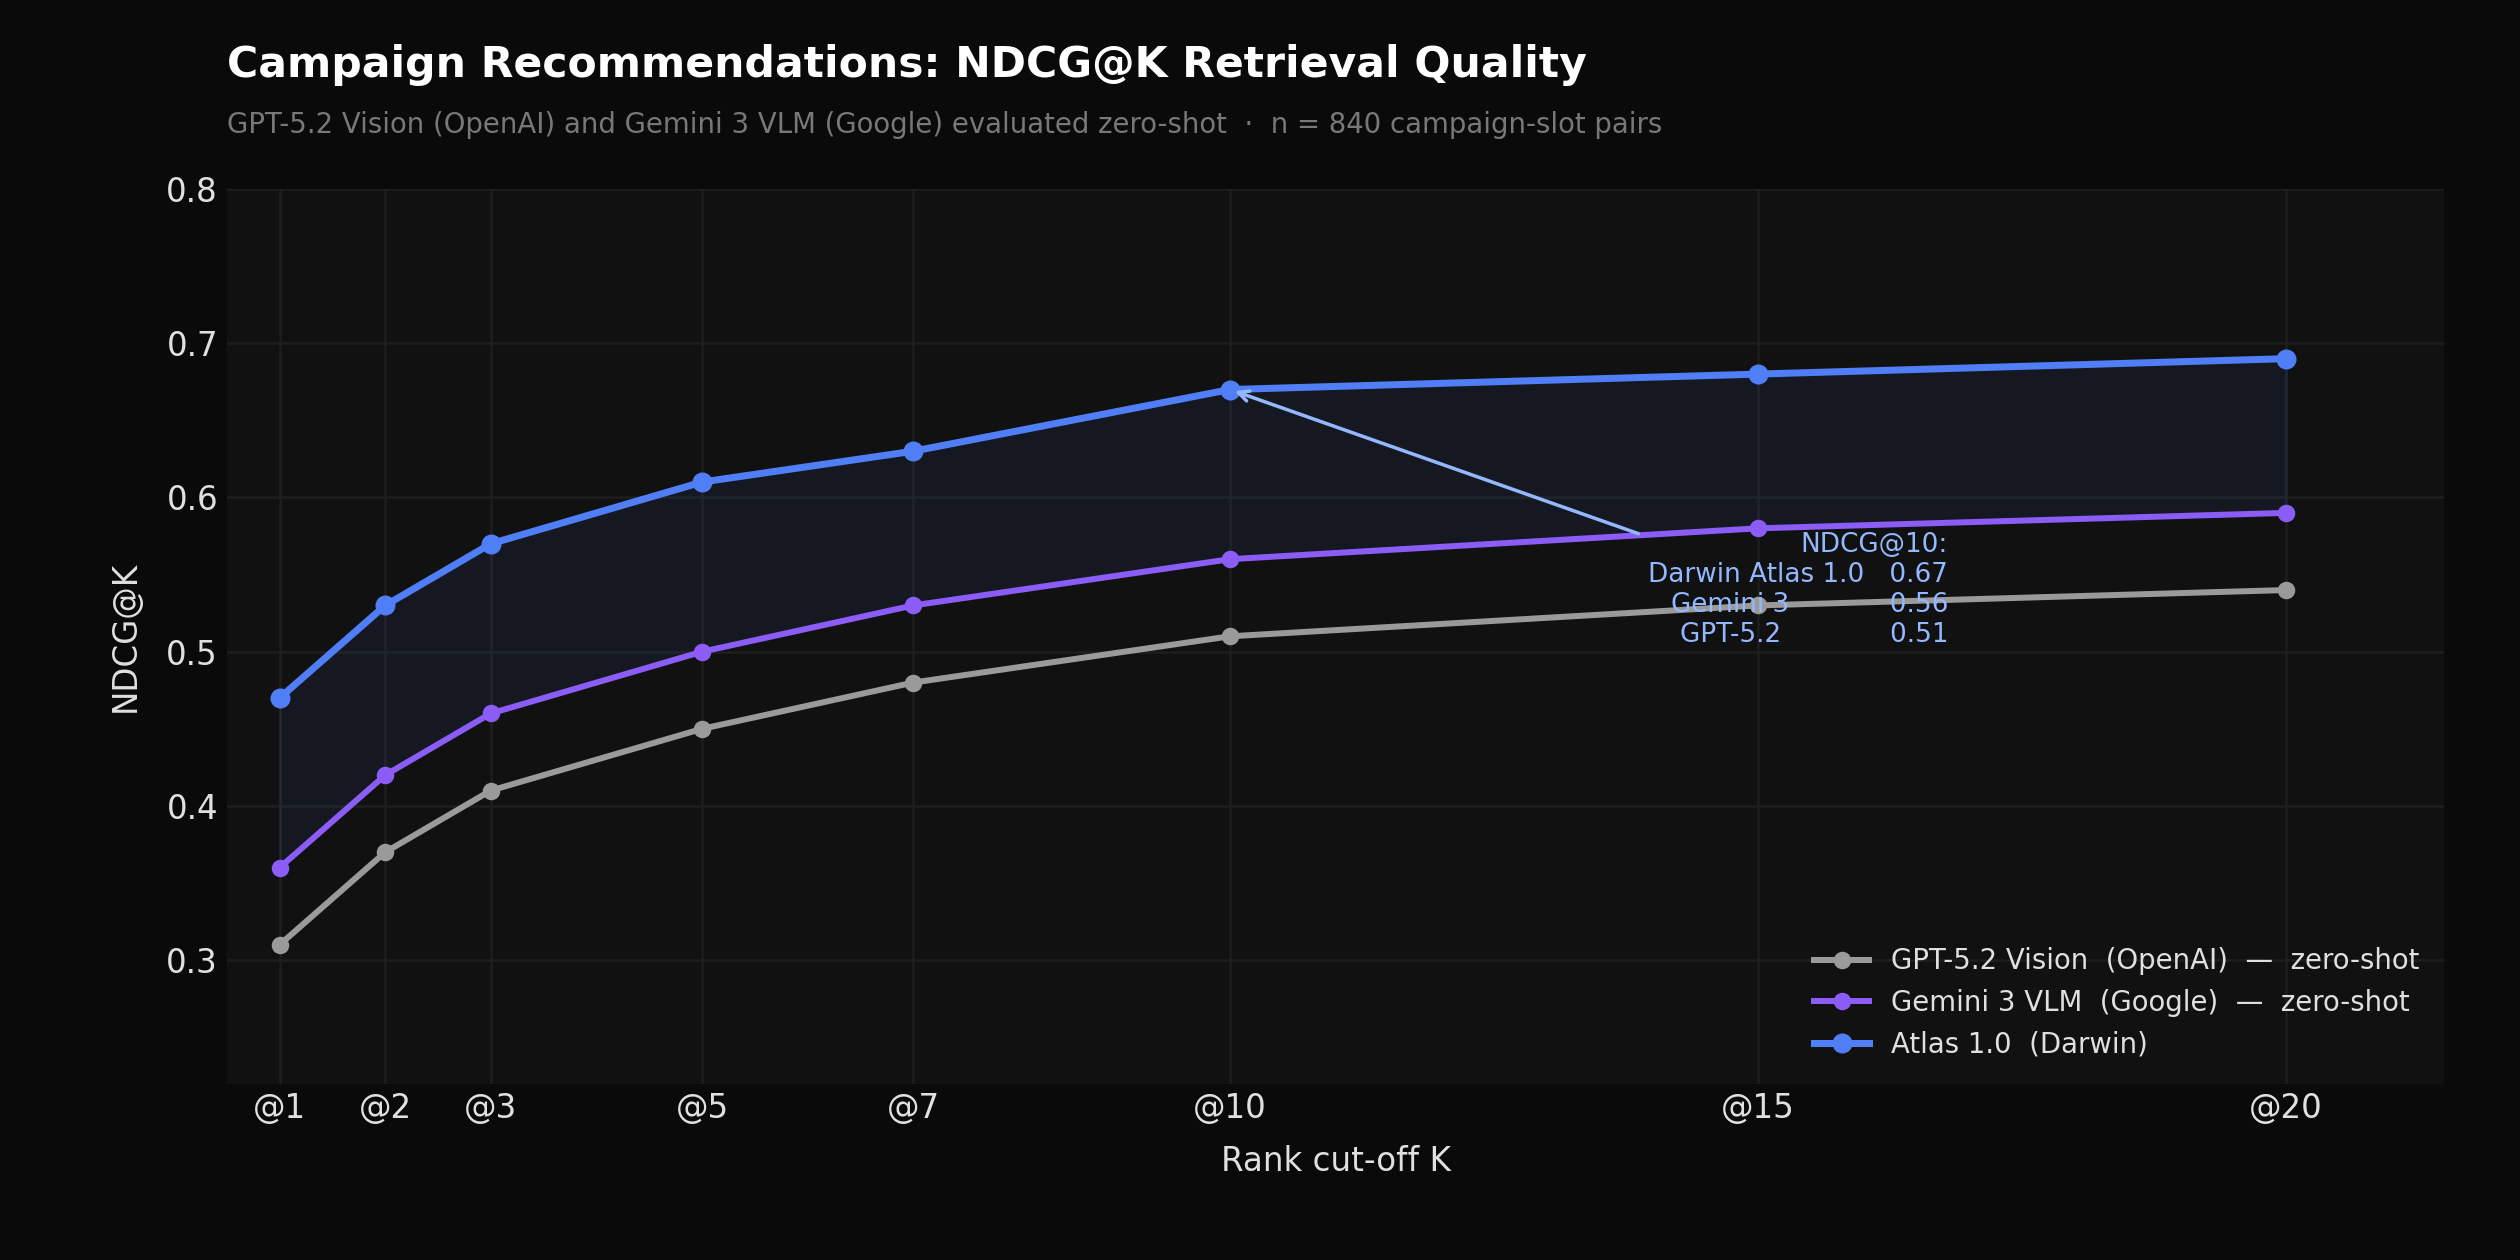
NDCG@K curves for Atlas 1.0 vs. GPT-5.2 Vision (OpenAI) and Gemini 3 VLM (Google), both zero-shot, across 6 campaign objective types
Retrieval surfaces candidates. Allocation distributes budget across them. A greedy allocation approach — ranking slots by match score and assigning budget top-down until exhausted — reliably identifies high-confidence placements but produces portfolios with poor diversification. Campaigns concentrated in a few high-ranking creators within the same content category carry correlated risk: if one underperforms, the others tend to underperform for the same reasons.
Atlas 1.0 formulates allocation as a constrained optimization problem. The objective is expected campaign performance — impressions for reach campaigns, projected engagements for engagement campaigns, estimated conversions for conversion campaigns — subject to budget, minimum diversification across creators and categories, and brand-specified risk constraints. The result is a portfolio that is both high-quality on average and resilient to individual placement variance. In backtests across 120 completed campaigns, the constrained allocation produced 14% higher realized ROAS versus greedy allocation, with 23% lower outcome variance across the same set.
What's Next
Generation, identification, and recommendations are live in Darwin Ads and Darwin Studio today. The fourth component — Ad Performance Simulation — ships in the next release, bringing pre-commitment performance forecasts and persona-level audience breakdowns into the planning workflow. We'll publish a full technical writeup when it does.
Authors & Contributors
Sanjit Juneja, Founder & CEO
Soham Parekh, Member of Technical Staff
Dmitry Strygin, Member of Technical Staff